Interesting data. The founders (Joel Spolsky, Jeff Atwood) are strong proponents of Windows programming, and the initial popularity of .net and c# make a lot of sense in that context. As the site has become more and more popular, the audience now consists of many people who aren't even aware of who those founders are, let alone follow their work. As such, the language spread is much more representative.
As someone who never goes anywhere near Windows programming, I'm quite pleased about the direction this trend has taken.
Given StackOverflow's structure and operational methods, one would expect questions about products in the Microsoft stack to decline as searches return more relevant answers.
To put it another way, as the site matures, more questions about x will tend to correlate to the inverse of x's formal repositories of knowledge.
A user who finds an answer to their ASP.NET question on StackOverflow, doesn't ask a new question.
In the lifetime of the site c# 3 came out with a lot of new programming paradigms, ASP.Net MVC has come out, Silverlight has come and gone, WPF has gone from being something no-one uses to something a lot of people do and windows phone and now windows 8 have come out.
Contrast that to Java which had Android, which people don't seem to bother tagging as Java? And that's about it I think? And Java grew and stabilized, so it really is probably just down to their initial users consisted overwhelmingly of .Net developers.
I can say anecdotally this applies to me. I use ASP.NET and C# heavily and am a daily user on StackOverflow, but I rarely find myself needing to ask a question there. I usually just find an answer to what I need and vote and favorite accordingly. It's become more of a repository of information for me than when it started out.
Some drop in ASP.Net/C# popularity wouldn't surprise me either though.
This is a problem I run into. As a more junior developer, nearly all of my questions I haven't been able to answer with research have already been answered on stackoverflow. Employers want me to have tons of points, but I don't usually have to ask any questions.
I posit that Microsoft has more to do with this trend than anything else.
I was a Windows / Microsoft tools only developer for many many years and only recently switched to Javascript / Node.js and OSS tools for our business applications.
My usage of S.O. almost exactly parallels what you see in that graph over the time period and I'm personally aware of a great many other Windows developers moving away from it recently.
The reason for myself has absolutely nothing to do with Joel or Jeff and everything to do with Microsoft pushing out the smaller professional developers who supported them and by extension Windows for decades in favour of policies that benefit only the very big software shops and students / dabblers and then recently with Windows 8 basically giving us all the final push away in many, many different ways.
As for your last sentence; as a professional software developer of well over 20 years who 'goes near' Windows programming and everything else I can get my hands on I can't fathom how anyone can take pleasure in less opportunity and a smaller market and fewer interesting platforms to work with.
It probably has more to do with the maturity of the framework and less to do with audience popularity (although I'm sure that is a factor). That's just the nature of SO. The ios graph demonstrates this.
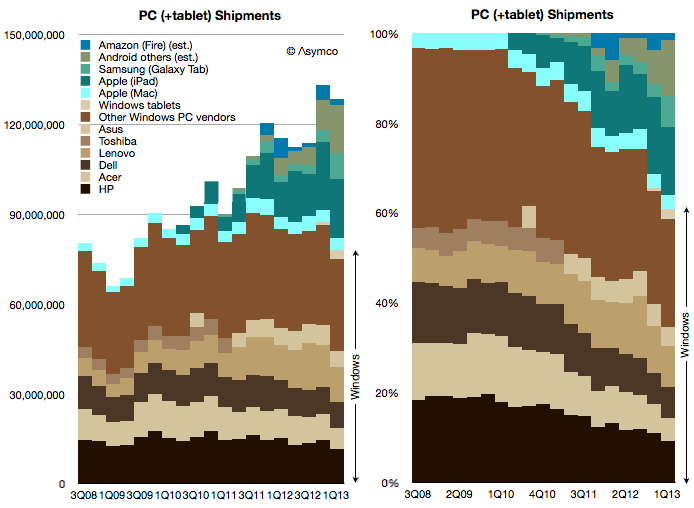
Think of it as a number of streams[1] running in parallel. The wider the stream, the more important the associated tag. Since the actual values are scaled to add up to 100%, comparing between relative importance is all they're good for.
There's also aa absolute version of this, which is a simple stacked area chart. It's not so useful here, because the relative popularity of tags is much more interesting than the absolute numbers, which are largely a function of StackOverflow getting more users in total. See for yourself: http://cl.ly/image/101e1y1q3i19
This chart plots the "share" of each question on the site, so the total is always 100%. If you read the chart from left to right you will see that the languages whose share increases become wider while those whose share decreases become narrower. It can be a bit difficult to read with this many options.
Yes that's how I originally tried it, but it was hard to pick out the trends since a bunch of lines were grouped together. Admit that the way its been done here is fairly strange, hopefully its useful to someone.
Wow. Stacked area charts are so bad at conveying information efficiently or honestly - this one would be a good parody if it wasn't presumably an honest attempt.
RE: inefficiency, note how bad the trend lines become near the top as the noise accumulates from the curves below. e.g. the galaxy tab curve on the left. I am reduced to visually converting areas into numbers (something humans are quite bad at) and searching for the previous data point, etc.
The one major thing this chart has going for it, though, is that it makes me want to play some old school video games.
"Here’s a fictitious example to show what I’m talking about."
Yes, the author's fictitious example sucks.
The chart I linked shows the data points as discrete, so it's actually the stacked column chart the author claims to prefer and eliminates the confusion between height and thickness (that said, I don't object violently to that specific issue since I know how to read the charts).
Why convert curves to numbers? If you just wanted numbers read tabular data.
Tufte uses the equivalent of stacked area charts in one of his most famous examples (Napoleon's attack on Russia). Is it the width or the height of the bar that connotes the strength of the army?
The graph you linked is discrete only by technicality (all data samples are discrete, after all.) Compare how yours is 19 time slices squished together into a width (normalized for aspect ratio) almost half the size of the one I linked, which is 6 data points with adequate white-space.
Please note that in the (excellent) Napoleon chart, cross sectional thickness is used to convey the size of the army.
Not only is this intuitive, but it is masterfully hinted by the way the line shrinks. Stacked area charts (as detailed in the article I linked) however are unintuitive - a slowly increasing trend stacked on a faster increasing trend will appear to decrease - this is very undesirable.
The chart you linked seems to want to say "The PC(+tablet) market is increasing, but Window's user base is stagnant". Either unstack the data or throw away/combine the irrelevant data. If you want to compare the Galaxy Tab to other Android tablets (as this chart seems to want to do as well) you will need a better chart or a second chart. The top of left chart is visual noise.
Given that ultimate volumes aren't relevant, I think a stacked line chart (with colours for each language) might be appropriate. You might need to bunch together the least popular languages as "other" to get that to work though.
What struck me however was how little the popularity of the largest languages changed in terms of their question frequency.
I think it's an exaggeration to say "it doesn't look pretty for Microsoft" especially since the drop in C# can be explained in part by Microsoft actively encouraging C# devs to start writing TypeScript/JavaScript applications. Microsoft has decided the future is TypeScript. If you want C# on mobile your best bet is to look at Xamarin, which is run by Miguel de Icaza of Mono fame. I'm curious how much MS has invested in that company.
Percentages are but one part of a trend. The graph is meaningless without total growth over time, and number of tags per user per tech. It could show anything, i.e. C# growth increase (or decline), even though the percentage overall is in decline.
No, it's Microsoft murdering its flagship product by enforcing retarded rules with WinRT and the Windows Store.
I love C# and I love working on Windows. But no way I'm going to pay money for there "privilege" of publishing open source software!
(you can't install Win 8 apps from anywhere except the store. Must you limited subset of APIs. Must pay yearly subscription to let people download your software. Screw that.)
I am teaching myself php (my first language) and I have seen that outside HN eco-chamber (and some other similar small community), PHP is not only very popular the communities are very newbe friendly.
Does the data provide views by tag? I'm a frequent beneficiary of SO content, but rarely have to ask new questions myself. Measuring views could give a more accurate depiction of how many devs are working on each tag.
It does provide that yes but I think it could be easy to skew that when a handful of questions get a huge number of views due to being linked somewhere like the stack exchange newsletters, or other places.
I was thinking the same thing. Most of the C# queries I might have had, have already been asked and answered effectively on SO.
However, that is probably also true for many other languages, and from a 30,000 foot view, this does look like either a shift in language popularity or a shift in the makeup of the SO visitor population.
So, are we seeing a fall of microsoft from the developers' point of view? Are windows phone and asp.net mvc not enough to try to get back the hackers in the platform?
No. SO was founded by two windows developers, and build on a windows stack. They had a podcast detailing the process of development prior to public release of the site, followed primarily by windows developers.
The initial audience of the site was, ergo, primarily windows developers. As popularity grew, more developers from the broader community showed up, driving the proportion of windows questions down.
Also as the knowledge base of questions for a tag grows, room for new questions become fewer. Duplicates will be asked but I wonder how many times a person has a problem, does a search, finds an answer and never has to ask their own question on the topic.
Unfortunately breakdown for the close votes is not available like for the flagged answers. But my experience with the review queue is that 1 in every 4-5 votes is due to a duplicate.
Considering there are 58.1k close votes to review at the moment... that's loads of dupes.
No. Stackoverflow goes though these "land grab" phases with languages and frameworks. Because C# was one of the early languages it is very difficult to keep up inertia of new questions.
My personal experience has been that I rarely need to ask new C# or MVC related questions these days. I really have a hard time coming up with something has hasn't been discussed already. I think Stackoverflow eventually hits a saturation point and people begin to consume more than contribute.
It has got to the point with SO that if a question is obscure enough that there isn't already a question for it, I know when I ask I'll likely not get an answer.
This was my interpretation, the largest downward movers across the board were the Microsoft stack technologies.
Perhaps, given this data is from a Q and A site, these languages have just gotten so amazing in the last three years that developers are collectively asking fewer questions because they're running into fewer critical / main sequence blocking issues. Maybe these languages have moved to only being deployed by established and professional shops, leading to less of the entry level developer "noise" questions on SO
[e]: sibling comment explains these trends, quite convincingly, as site demographics.
I'd love to see this data compared to a similar set from github. Although public repo stats would suffer the same selection bias as SO posts.
It seems to me that this graph represents newness not popularity (to the degree it represents anything at all). That is when tech is new or has a new release more questions are asked about it. Once those questions are answered, fewer and fewer questions remain.
However, the problem is there are lots of noise sources. Is the tech complicated/confusing so lots of clarifying questions are asked? Are there lots of updates and releases? It the tech a lot larger in scope, such that it takes more questions to cover it? Is it in very heavy use and people are typically well versed in it so there are fewer questions? etc.
All in all I'm afraid it is hard to draw any meaningful conclusions from this, and easy to be mislead.
Lotta java haters yet it stays steady. I also remember 1-3 years ago HN was full of RoR fanboys but its been pretty slow since and SO trends aren't good. It's interesting how things change and what becomes more fad like. They're both good languages, I'm just saying this to say there are no magic silver bullets ;)
Personally i think that what happened is that RoR just didn't scale to bigger projects. Java isn't perfect by any means but right now there isn't anything that scales out as well. And by scales out I don't necessarily mean performance, I mean team size.
Python seems to be used in a lot of contexts, not limited to web development. While Ruby is a lovely language it appears to be used primarily with Rails in a web context.
Python also has a large amount of Scientific packages and draws a number of people from that field. Not sure how much that helps the marketshare though. I don't think it's strictly a Rails/Django thing.
Python Libraries > Ruby Libraries, at least outside of the web development world. There is nothing even close to the quality of SciKit-Learn, Pandas, NumPy, SciPy, Mapnik, PyCUDA, Sage, PyQT, PyGTK+, PIL, Celery, etc.
Ruby is an amazing language (as far as mutability-by-default languages go), but it is far too web-centric...which seems to have turned into a self-fulfilling prophesy.
Notice how many of those are actually bindings for C/C++ libraries: a relatively hard problem for most high-level languages, but one that CPython makes very very easy to solve. These days, it's not surprising to see new libraries providing Python bindings from the start.
It would be interesting to see the tags compared to each other by their relative bucket. As in IOS/iPhone/Android or web frameworks Django/RoR/Play/etc compared.
Also I'd be interested in knowing how the java popularity is without android (postings without the android tag).
Agreed with buckets. The iPhone tag drops to next to nothing, but iOS rises. I suspect this is due to people programming more for the iPhone/iPad family rather than just the phone. I wish that they were all grouped.
Surprised to see Objective C dropping; I wonder why that is? It sure doesn't feel like iOS is getting more web view apps, and with the increased frequency and quality of apps on the App Store in lieu of iOS porting, you'd think it would go up.
Its not really dropping in terms of total questions asked, (obj-C has been sort of constant for about 12 months) but the other tags are increasing. The chart shows a proportion of the top 25 tags.
I think that highlights a problem with the way the data is presented. jQuery clearly belongs with JavaScript, just as iOS and Objective-C belong together.
As someone who never goes anywhere near Windows programming, I'm quite pleased about the direction this trend has taken.