Oh! This is applying FFT to the images! I thought it was going to be applying to functions
f_n : [0,2pi] -> [0,1]^2
where f_n is the n-th level version of the curve.
I guess in that view, higher order curves would have higher frequencies have higher amplitudes, on account of changing direction more often.
I guess that view of things wouldn’t have much visual appeal, as it would just be associating to each integer frequency, an individual vector. (I guess a 2d complex-valued vector?)
Hm, still, I think there would probably be uh, something to see in the directions of these vectors?
And to handle the complex-valued stuff I would think that if you moved from the e^{i t n} basis to the cosines and sines basis, that one could maybe thereby do-away with that? Or...
Well, yeah, that should be true, expressing a real valued periodic function as a weighted sum of sine and cosine functions doesn’t require any complex coefficients, but would doing so actually make the vectors which are the pairs of the coefficients for the two axiis, have a particularly clear meaning?
I would imagine the direction of these vectors should correspond to something like the different directions the curves move in, or differences between these directions.
Oh! One thing that might be nice visually,
If you got the Fourier coefficients for the n-th level of the curve, and then took only the first k coefficients and constructed the curve associated with that, then that might be cool looking.
I wonder, if you held k constant, but increased n, would the first k coefficients converge? If so, what would the curve from those first k coefficients look like?
I never got that far - I was primarily considering it as a point location definition for an image format, and I wanted a symmetrical curve.
You can actually do that, if you relax the constraint that no grid point is shared (it's not really that big a problem, you just need to base the transform on the location between pixels, and not the centres of the pixels).
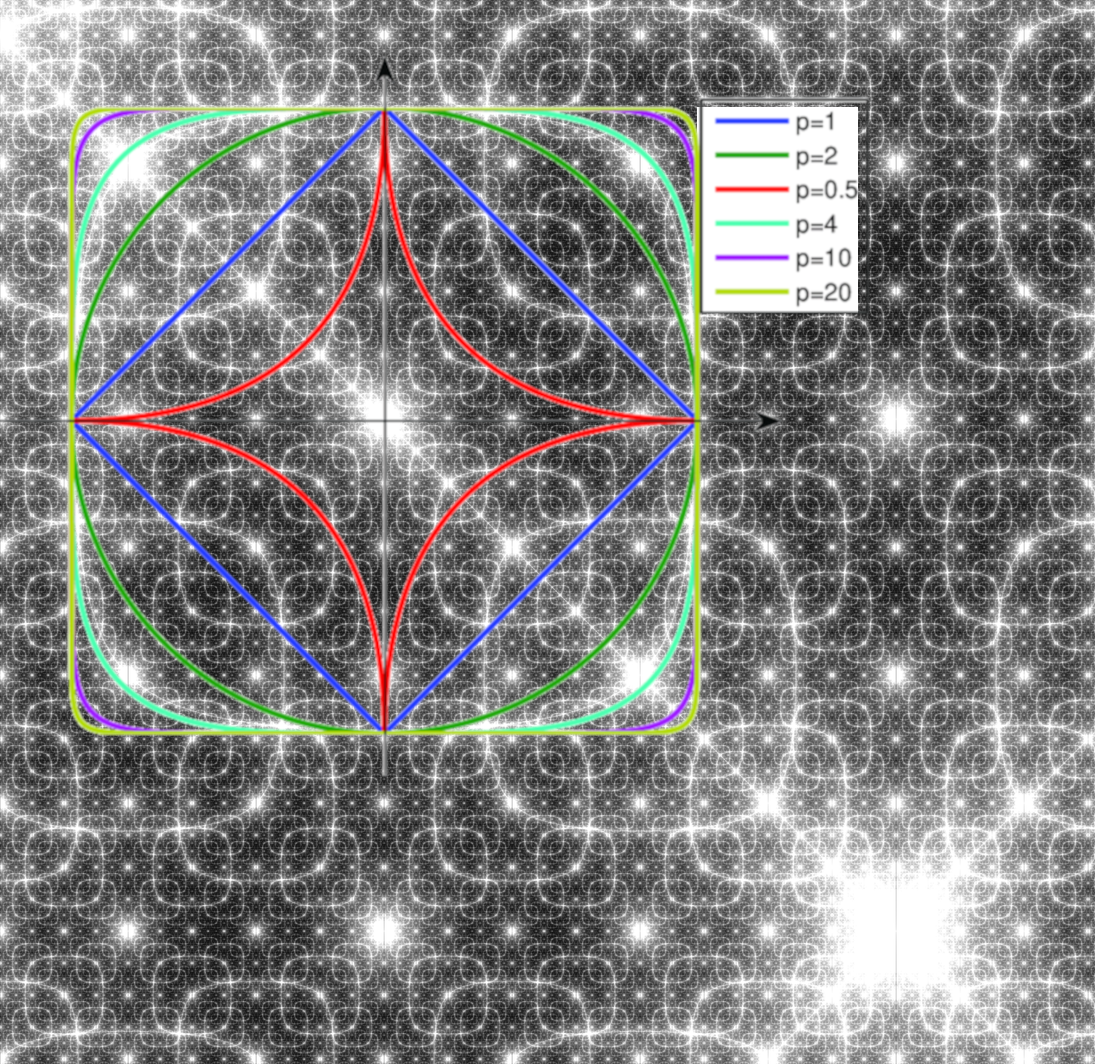
It's not plane-fillingness, but fractalness of the inputs that makes the DFTs look interesting. So I'd experiment with other L-space system curves. A fractal has some periodicity that appears as bright lines on DFT, and when you add an extra level of recursion, the original periodicity remains and it gets supplemented with its harmonics. I'd also try to interpret a diagonal scan of the DFT images as a sound waveform, probably scaled down to fit it into the audible range. There's also a related so-called Radon transform that would make the DFT images more roundish.
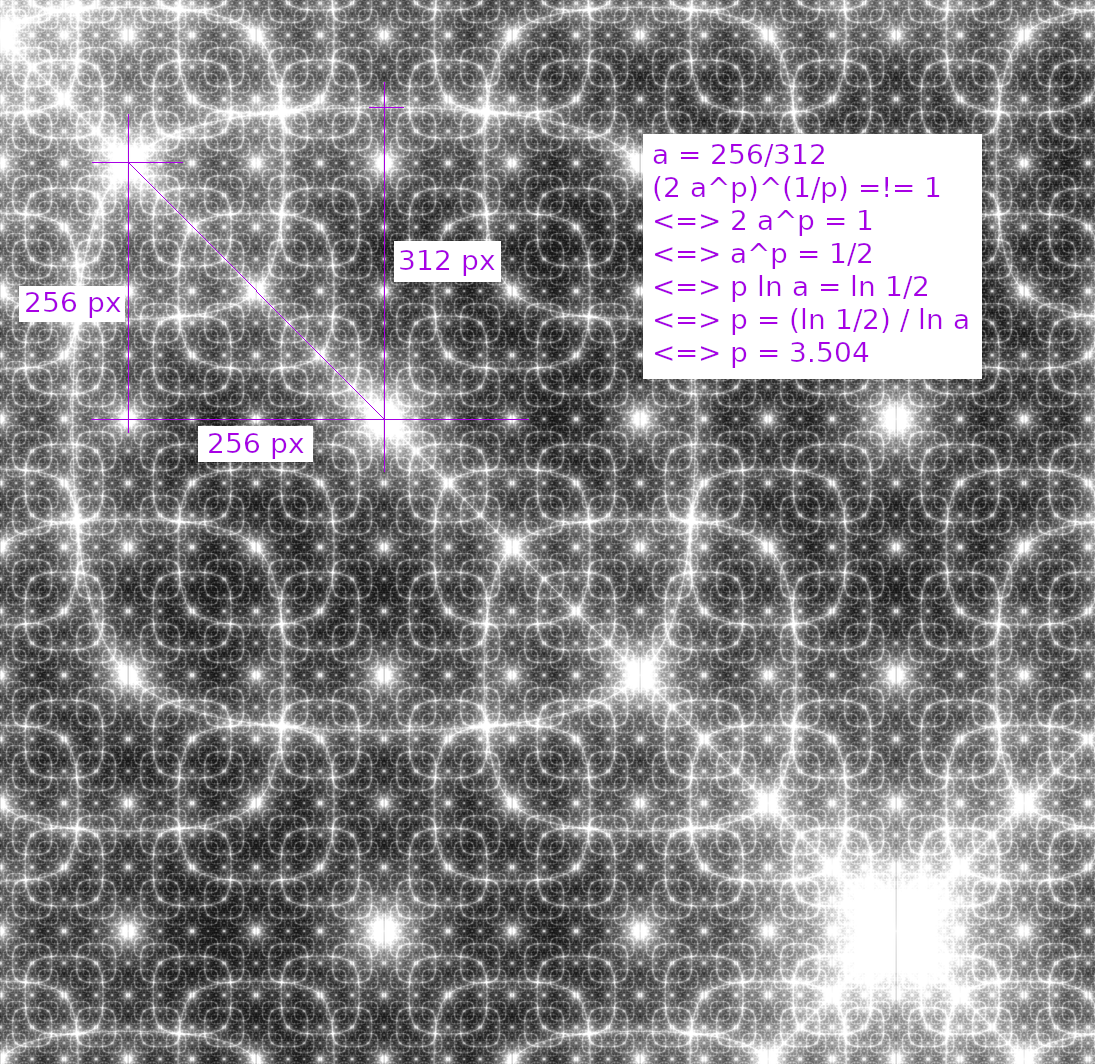
To summarize, the FFTs also have a recursive nature, which becomes more fine-granular with each recursion depth in the original. For example, this trippy FFT https://raw.githubusercontent.com/mxmlnkn/fft-image-experime... shows that the hierarchical square pattern probably repeats ad infinitum. Note that those details that get added with more recursion get lost when downscaling the images and the nearest-neighbor-upscaled images almost look like they are dithered: https://github.com/mxmlnkn/fft-image-experiments/raw/master/...
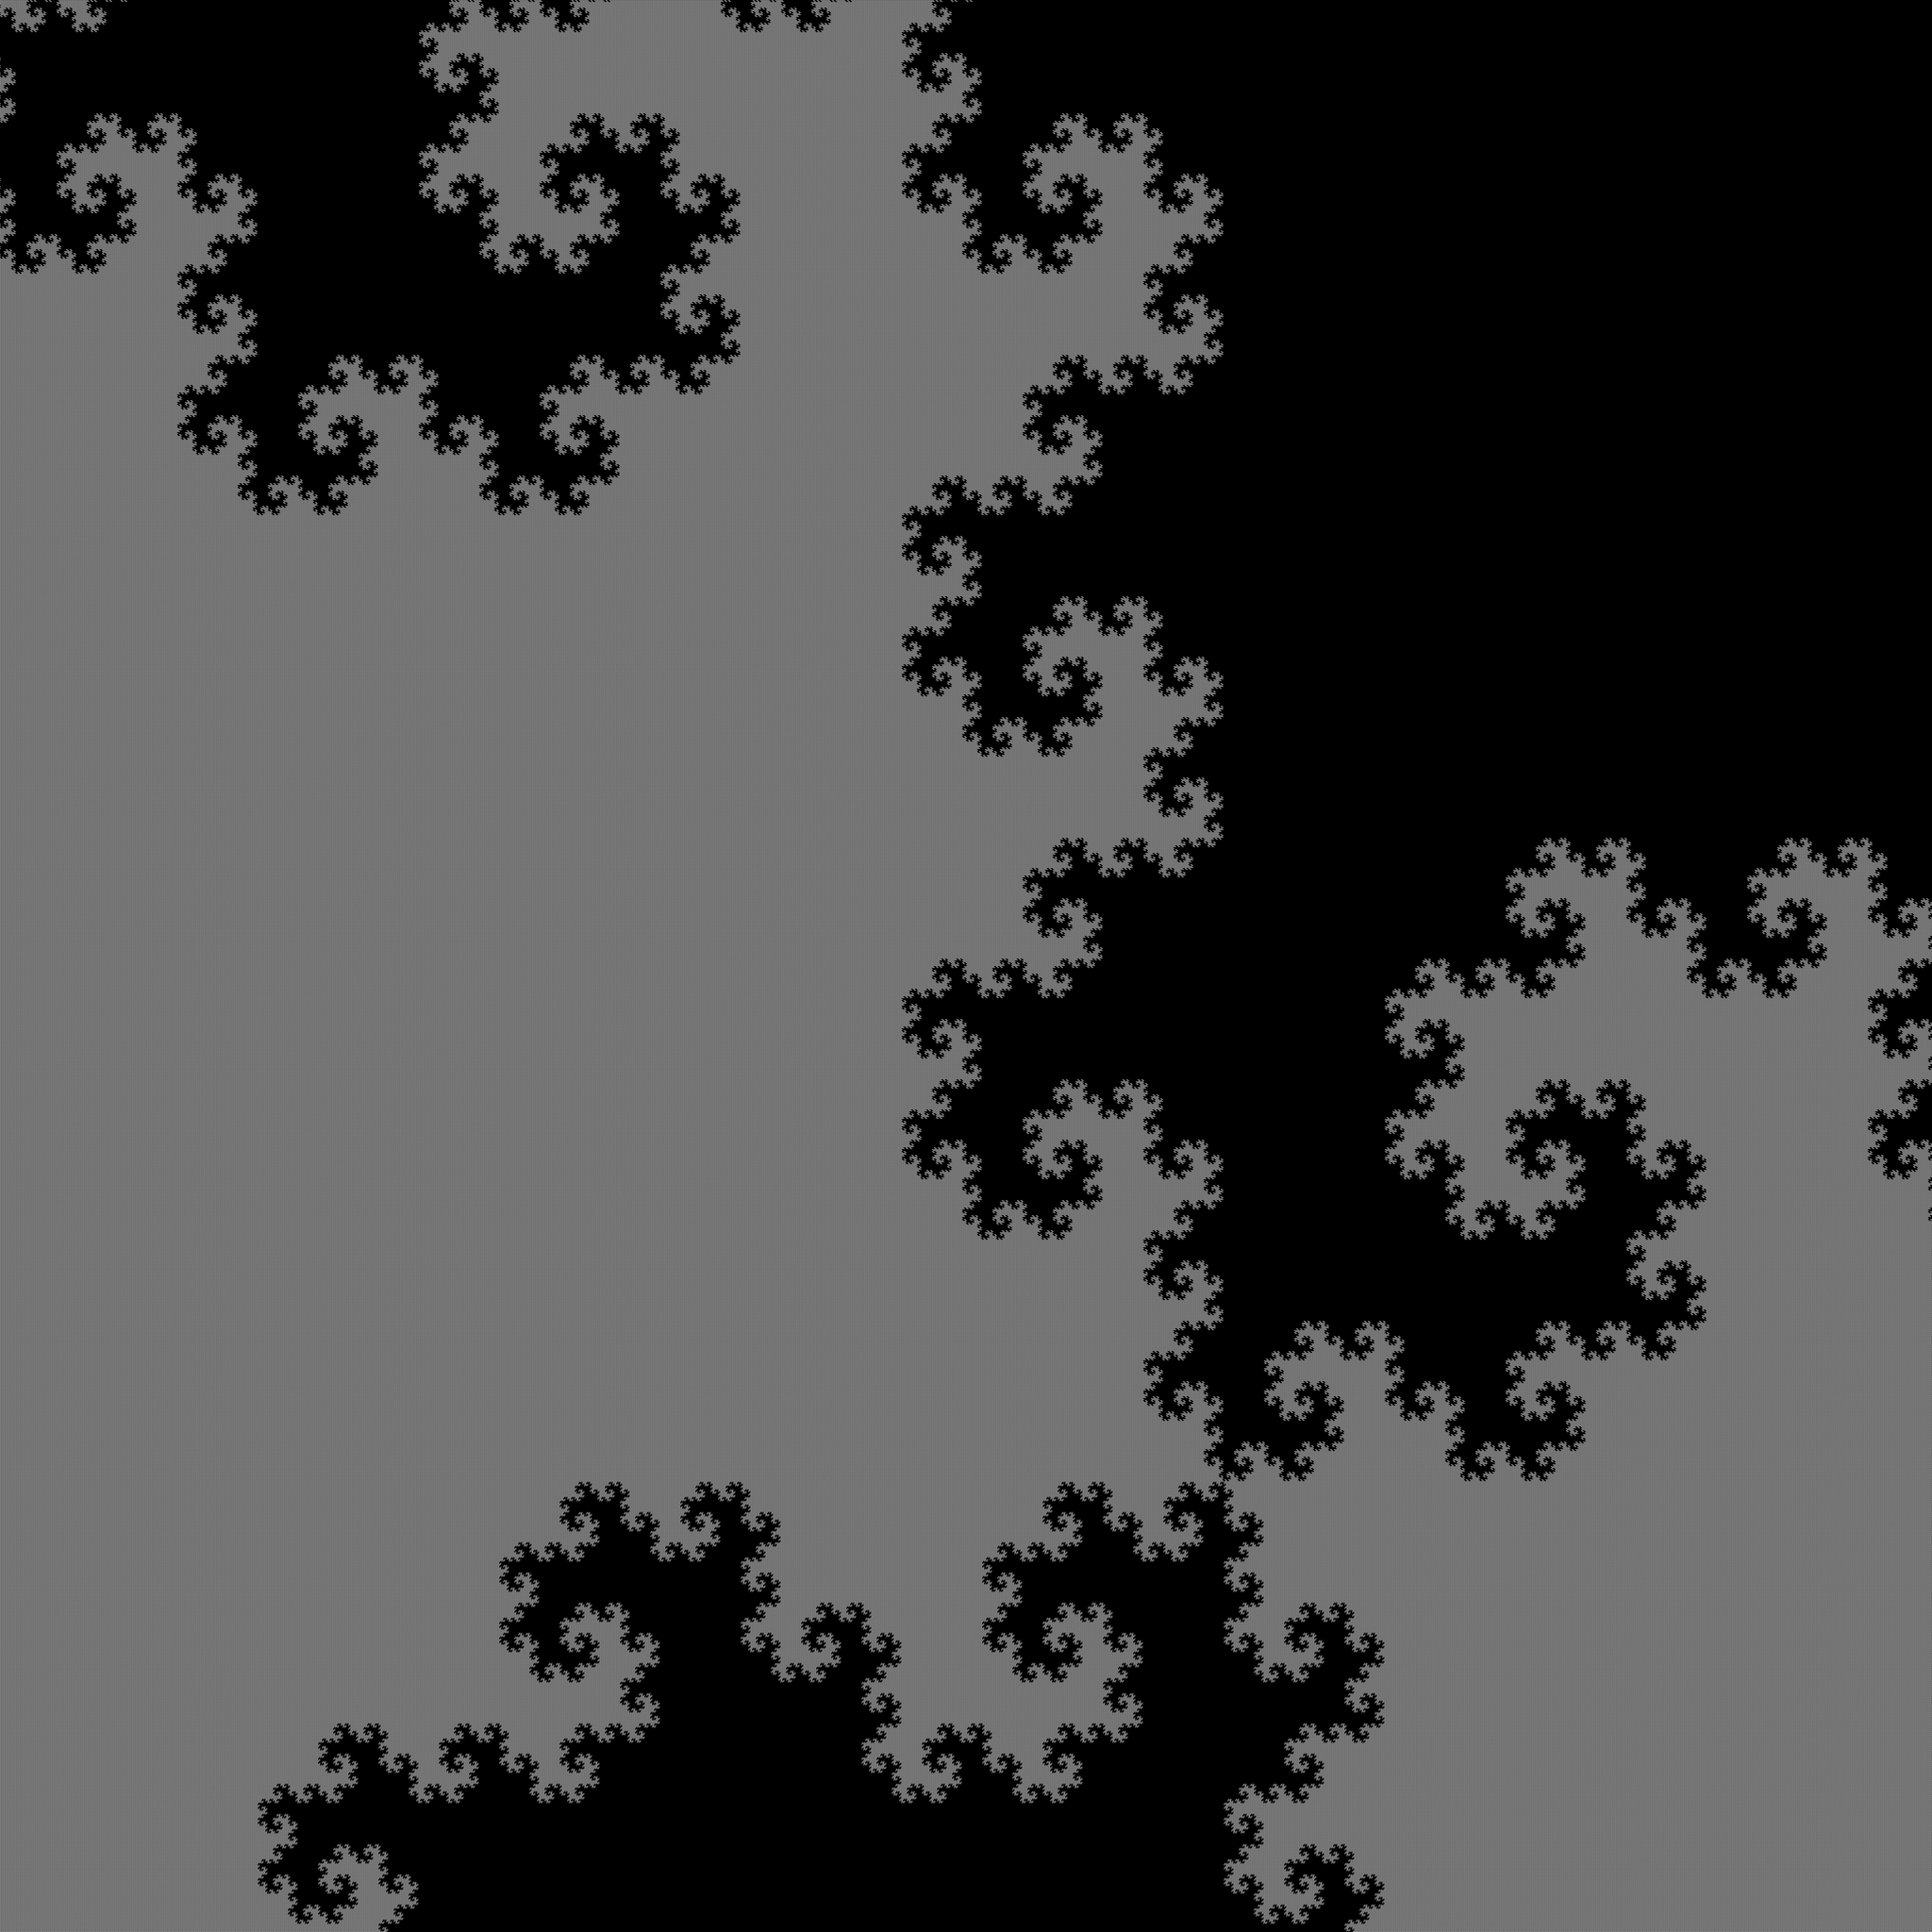
It is interesting though that the Fourier transform has a recursive nature that is still visible when downscaling a larger image. When doing that for any of the space-filling curves you basically just get a gray image because they evenly fill the space. Well, the Dragon curve and the Gosper Diagram do have boundaries that are still visible even when downsampling large-resolutions versions:
Hilbert Curve that simply looks gray when downsampled:
The results of the Hilbert and Hilbert-like curves look similar to the Robinson’s aperiodic tiling of the plane[0]. In that picture they use squares and rounded squares, but if you did all rounded squares, I think it would look more similar.
Hmm, I was thinking about building a 2d game solver with a LLM and I was wondering the other day if there is a better way to represent 2D data instead of just raster scanning it to a vector. probably a hadamard transform might work out better but the hilbert pattern looks interesting too.
its basically trying to figure out the best way to represent 2D or 3D data to be vectorized and fed to a LLM for a puzzle game. I am rather new to the field so may not be using the right terminology.
The idea is to create a bunch of these random game boards and generate various intermediate player states leading to a solution so the LLM can learn from it & then ask it to come up with steps to solve for a new board config.
Its not a serious product, I am just trying to get my feet wet and understand how to use these transformers.
I guess in that view, higher order curves would have higher frequencies have higher amplitudes, on account of changing direction more often.
I guess that view of things wouldn’t have much visual appeal, as it would just be associating to each integer frequency, an individual vector. (I guess a 2d complex-valued vector?)
Hm, still, I think there would probably be uh, something to see in the directions of these vectors?
And to handle the complex-valued stuff I would think that if you moved from the e^{i t n} basis to the cosines and sines basis, that one could maybe thereby do-away with that? Or... Well, yeah, that should be true, expressing a real valued periodic function as a weighted sum of sine and cosine functions doesn’t require any complex coefficients, but would doing so actually make the vectors which are the pairs of the coefficients for the two axiis, have a particularly clear meaning?
I would imagine the direction of these vectors should correspond to something like the different directions the curves move in, or differences between these directions.
Oh! One thing that might be nice visually, If you got the Fourier coefficients for the n-th level of the curve, and then took only the first k coefficients and constructed the curve associated with that, then that might be cool looking. I wonder, if you held k constant, but increased n, would the first k coefficients converge? If so, what would the curve from those first k coefficients look like?