A very interesting trick! In my opinion, the big takeaway here is that if you are willing to write your C code in tail call style, you can get a lot of control over which variables are stored in machine registers. In the x86-64 ABI, the first 6 function parameters are guaranteed to be passed via registers.
Obviously, this is architecture-specific. Other architectures may use a different calling convention that ruins this kind of manual register allocation. I'd imagine that it would be bad for performance in 32-bit systems, where function arguments are passed via the stack.
--------
> I think it’s likely that all of the major language interpreters written in C (Python, Ruby, PHP, Lua, etc.) could get significant performance benefits by adopting this technique.
I know that at least Lua and Python use "computed gotos" in their inner loops, which also helps the compiler generate better code. The architecture-dependent nature of the tail-call trick could be a problem here. Some of these interpreters also need to work well on 32-bit systems.
Yep, that's exactly the right takeaway. :) I have verified this on ARM64 also, but architectures that pass parameters on the stack will make this technique not really worth it.
Yes, there are portability issues with the tail call approach, so there would need to be a fallback on non-x64/ARM64 platorms. This would add complexity. But it's exciting to think that it could unlock significant performance improvements.
It's a bit of a weird case for Haskell. Because of laziness, you don't always want tail recursion (in fact sometimes you definitely don't want the tail recursive version). The classic example of this is foldl vs foldr.
  -- Tail-recursive so must be good right?
  -- That way lies thunk accumulation and *non-constant*
  -- additional memory usage for a lot of functions f
  foldl f acc []     = acc
  foldl f acc (x:xs) = foldl f (f acc x) xs

  -- In contrast, this definition often results in constant
  -- additional space usage despite the non-tail call.
  foldr f acc []     = acc
  foldr f acc (x:xs) = f x (foldr f acc xs)
Tail recursion is an unalloyed good only for strict languages.
Although I'm not sure why you put mutual in parentheses and maybe you meant to address laziness with that?
You are right indeed regarding that there are cases where trail recursion does not work. But in this case I would say that the culprit is the laziness of f.
I put mutual in between parentheses because not all languages support optimising mutually tail recursive functions.
On the matter of portability, I wonder if it would be possible to use some macro magic and/or a code generator to convert the tail-call version back into a more traditional while/switch loop, for the stack-based architectures.
While the tail call version is more architecture dependent, it's nevertheless more portable than assembly language. It's still C.
I haven't implemented the fallback yet, but my thought was to keep most of the structure the same (dispatch function tail calls to the function for an individual operation) but then have the individual operation just return instead of tail calling back to dispatch.
I think this would be portable while still avoiding some of the performance problems associated with a traditional switch (like the bounds check).
I'm curious how this approach would fair for microcontrollers, well cortex m0-m4's actually. They're arm32 bit and may not have enough useful call registers. Still parsing protobuf's or interpreting WASM faster would result directly in better battery performance, etc.
Regarding PHP specifically, the interpreter's opcodes are all described in a meta language, and the actual PHP interpreter can be code-generated in 4 different styles depending on what is fastest for the target C compiler.
See ZEND_VM_KIND_CALL / SWITCH / GOTO / HYBRID in php-src/Zend/zend_vm_gen.php
> the first 6 function parameters are guaranteed to be passed via registers.
This assumes that your function is being called via the regular calling convention. By the as-if rule there is nothing guaranteeing that an internal call is using the regular calling convention or that it hasn't been inlined.
Are there cases where a compiler reasonably would internally use a different calling convention that supports fewer arguments passed via register passing?
Yours is still a valid point (no reason doesn't imply a guarantee) even if there's none, to be clear. Just curious because I can't really see any reason for a compiler to do so.
I can imagine some theoretical cases where compiler optimizations lead to additional arguments to be passed to a function [version].
Yes, in cases where optimizations would call for it.
If a function is marked `static` for example (in C) it means that it's private and local to the translation unit, which means there doesn't need to be a standard ABI agreement between it and external consumers, thus compiler is free to optimize calls or even inline it if necessary. This can drastically reduce both code size and runtime cost.
I agree it is unlikely. I can imagine something like the compiler realizing that some computation is pure, so it caches the value across invocations of the function, essentially adding addition arguments that push the actual arguments onto the stack. Of course this is an unlikely edge case but a reasonable set of possible optimizations that would work together I'm a surprising way.
We use the "noinline" attribute to get control over inlining, which gives a reasonable assurance that we'll get a normal standard ABI call with six parameters in registers on x64/ARM64.
That doesn’t disable other optimizations like cloning and IP-IRA (if those still exist), so it’s still possible to get a different calling convention. That would hopefully have more registers in use though, not less.
Modern compilers can compile tail calls of unknown functions (i.e. function pointers) to jumps; so instead of using "computed gotos" (which IIRC is a GCC extension), one can use ANSII C and get more efficient code (because of control of registers)
I'm not a C programmer at all, so please forgive me if this question doesn't make sense. If I remember correctly, there is a `register` keyword in C that you can use to hint the compiler that a given variable should be stored in a register. I think I've never seen this keyword in use, and I'm wondering why. But I think it would be useful for this same use case, without requiring tail calls and with the advantage of being fully portable.
`register` was used as a hint, and things like LLVM have Mem2Reg optimization passes that do a much better job at this sort of promotion.
IIRC register was mainly used in cases where hardware were involved, much like the volatile keyword. However unlike volatile, I don't believe register is even considered by compilers these days.
> Tail calls solve this problem. Each switch prong would return foo() (tail call) and foo() at the end of its business would inline call a function which would do the switch and then tail call the next prong.
> This is reasonable in the sense that it is doable right now; however there are some problems:
   * As far as I understand, tail calls don't work on some architectures.

     * (what are these? does anybody know?)

   * I'm also concerned about trying to debug when doing dispatch with tail calls.

   * It forces you to organize your logic into functions. That's another jump that
     maybe you did not want in your hot path.
It sounds like the main question in the proposal is: how can we reliably get the compiler to generate threaded/replicated dispatch?
While that is important, it is only one small part of what we were trying to achieve with tail calls. Ultimately we found that our tail call design significantly improved the register allocation and overall code generation compared with computed goto, see: https://gcc.gnu.org/pipermail/gcc/2021-April/235891.html
I really want a timeline where we have tail calls everywhere and this drama can go away. The non-tail call folks feel like folks arguing for not using spaces in text.
I do think tail call optimization can make debugging/stack traces confusing if you do general TCO. In the plain single function case, TCO probably makes it easier to debug, but it can get confusing if function A calls B and then B calls C in tail position so the stack trace is just C|A. It's probably not too bad if it is just one function getting elided, but this get very difficult if multiple important calls are being removed from the stack.
This could also be a case of insufficient tooling for languages with TCO. Better support for reverse debugging would make detailed stacks less necessary. Most of the stack trace isn't that useful anyway when printing out exceptions compared to good application logging.
Don’t we have debug symbols or something like it to be able to translate the optimised version into the thing you saw in code? If you need to dive into the assembly you are in for a hell of a ride anyway due to all kinds of optimisations happening.
And tail recursive functions encode their state in the args and the body. There isn't any information in the stack anyway, by definition.
If one does need to debug mutually tail recursive functions, step through them, this isn't a problem. The point is that they don't consume stack space. If you do want a stack of invocations, then don't write tail recursive code?
This style of argumentation that the GP showed should have a name.
BTW my original comment is at -1, hate but only in the tail position.
> There isn't any information in the stack anyway, by definition.
This is untrue. There are 3 possibilities:
  1. Constant stack space (perhaps zero) across calls with caller-cleanup
  2. Callee-cleanup
  3. Caller-cleanup where an argument indicates how much stack space to clean/where to set the stack pointer
I have to admit I had little interest in tail calls myself until I saw what they could achieve performance-wise. Now that I have seen that, I am sold. :)
Performance is only one small aspect, the things you can express in tail recursive functions are beautiful and compact. If feels like being in an inductive proof playground.
Scheme has had tail calls as a basic idiom (some call it Proper Implementation of Tail Calls; others call it Tail Call Optimization) forever, and I keep them in mind any time I'm implementing anything nontrivial in Scheme.
There's no special syntax -- there's just the notion of tail positions, from which tail calls can occur. For example, both arms of an `if` form are tail position, if the `if` itself is. And if you introduce a sequencing block in one of those arms, the last position in the block is tail position. (A specialized IDE like DrRacket can indicate tail positions, and DrRacket will even hover arrows, tracing the tail positions back to the top of the code.)
When implementing a state machine, for example, a state transition is simply a function application (call) to the new state (optionally with arguments), where the the called function represents a state. It's satisfying when you realize how elegant something that used to be messy is, and you can imagine it being very fast (even if your Scheme implementation isn't quite up to getting as fast as a C or Rust compiler that can recognize and special-case tail calls.)
(For the state machine example, compare to more conventional approaches in C ,of "state ID" variables, `switch` statements on those, and record-keeping for additional state. Or doing it in data, with state ID being index into arrays, again with any additional recordkeeping. Or lots of function calls when you didn't really need the time overhead and stack usage of function calls with full returns.)
You just push the stack into the heap, and don't have a specific area which is the stack area. It's pretty common as a technique if you have something such as call-with-current-continuation.
The "stack" is still there in this case, but spread out over multiple heap blocks.
Guie Scheme does something similar then. It expands the call stack so that you can't have a stack overflow. Pretty neat since it allows you to write recursive functions without accumulators.
I suspect something like that is a bigger deal in eagerly evaluated languages.
Recursive descent parsers are, in a way, state machines as well. Writing something like a CSV or JSON parser in scheme is so much nicer than having to do it the old fashioned way.
Protobufs are very important for Google. A significant percentage of all compute cycles is used on parsing protobufs. I am surprised that the parsing is not doing using handwritten assembly if it's possible to improve performance so much.
Protobuf's abysmal performance, questionable integration into the C++ type system, append-only expandability, and annoying naming conventions and default values are why I usually try and steer away from it.
As a lingua franca between interpreted languages it's about par for the course but you'd think the fast language should be the fast path (ie: zero parsing/marshalling overhead in Rust/C/C++, no allocations) as you're usually not writing in these languages for fun but because you need the thing to be fast.
It's also the kind of choice that comes back to bite you years into a project if you started with something like Python and then need to rewrite a component in a systems language to make it faster. Now you not only have to rewrite your component but change the serialization format too.
Unfortunately Protobuf gets a ton of mindshare because nobody ever got fired for using a Google library. IMO it's just not that good and you're inheriting a good chunk of Google's technical debt when adopting it.
Zero parse wire formats definitely have benefits, but they also have downsides such as significantly larger payloads, more constrained APIs, and typically more constraints on how the schema can evolve. They also have a wire size proportional to the size of the schema (declared fields) rather than proportional to the size of the data (present fields), which makes them unsuitable for some of the cases where protobuf is used.
With the techniques described in this article, protobuf parsing speed is reasonably competitive, though if your yardstick is zero-parse, it will never match up.
Situations where wire/disk bandwidth are constrained are usually better served by compressing the entire stream rather than trying to integrate some run encoding into the message format itself.
You only need to pay for decompression once to load the message into ram rather than being forced to either make a copy or pay for decoding all throughout the program whenever fields are accessed. And if the link is bandwidth constrained then the added latency of decompression is probably negligible.
The separation of concerns between compression format and encoding also allows specifically tuned compression algorithms to be used, for example like when switching zstd's many compression levels. Separating the compression from encoding also lets you compress/decompress on another processor core for higher throughput.
Meanwhile you can also do a one shot decompression or skip compression of a stream for replay/analysis; when talking over a low latency high bandwidth link/IPC; or when serializing to/from an already compressed filesystem like btrfs+zstd/lzo.
It's just more flexible this way with negligible drawbacks.
Recently I've been looking at CapnProto which is a fixed offset/size field encoding that allows for zero copy/allocation decoding, and arena allocation during message construction.
One nice design choice it has is to make default values zero on the wire by xor'ing all integral fields with the field default value.
This composes well with another nice feature it has, which is an optional run-length style packed encooding that compresses these zero bytes down. Overall, not quite msgpack efficiency but still very good.
One even more awesome feature is you can unpack the packed encoding without access to the original schema.
Overall I think it's a well designed and balanced feature set.
I’ve been using CapnProto, and while I like it, it certainly has a small community, and support can suffer due to that. I haven’t tried it, but have heard good thing about flatbuffers, and would def give that a second look if I were to make the decision again.
- No need to build messages 'inside out' / leaves first to get zero copy behaviour. This is huge.
- Fully functional RPC implementation with really interesting latency hiding behaviour via asynchronous promises. It's got most of what I want from gRPC without the horrid googlisms and dependencies.
- CapnProto has a canonical encoding, which makes it suitable for hashing and comparison.
- It has a packed encoding, whereas with Flatbuffers you're going to have to compress with a more hardcore codec like zlib.
- CapnProto supports runtime reflection via a dynamic API. This is useful in cases where you really need it, like when creating generic bindings for dynamically typed languages or use cases. Like protobufs it has a "lite" mode to opt out of this.
- CapnProto JSON support in the library is better, probably due to the above.
Major cons:
- Ugly schema format.
- Not header only (I've not tested whethwr or not there is a positive here with respect to build times)
- The "kj" support library is a bit of a pain in the ass, refusing to use common C++ vocabulary types like string_view or support common STL data structures like vectors or strings. Writing a message in to a std::vector for instance will require a specialization of an interface.
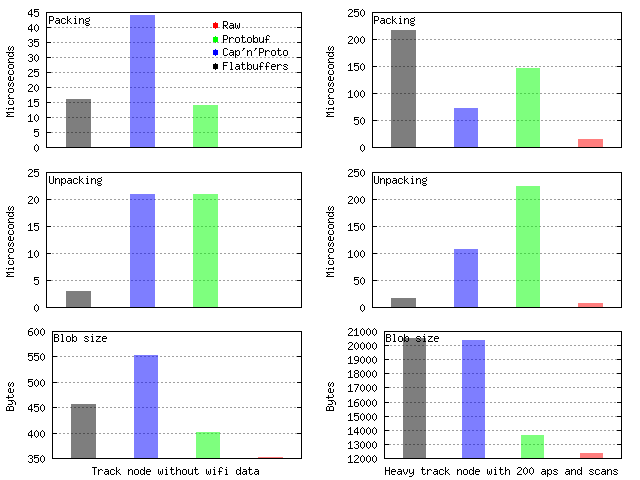
Few years back, i actually compared the three serializations, for the data i used ironically raw struct came on top for every benchmark https://cloudef.pw/protobug.png
This matches my experience as well. You should probably add code size to the graphs. Raw struct probably wins there too.
The only thing I’ve seen that’s competitive to raw struct is writing a C++ template visitor style pattern to walk the struct fields using inline methods. (This can be achieved in some other compiled languages, of course.)
It lets you compress things as you walk the struct, and breaks the dependency on struct layout (which can matter for cross-platform stuff, and for versioned protocols). It’s not quite as fast as a memcpy off the network buffer, but it can be branch and virtual dispatch free (not counting branches in the compression logic).
Also, it can validate as it copies the data into the struct, so now you can auto-generate application-specific validation logic. This is a big deal, since validating the output of a deserializer is almost as hard as hand deserialization!
I really liked the article however. Forcing tail optimization in the c++ template serializer sounds like it will substantially improve the (worst case) generated assembly.
We jumped from protobuf -> arrow in the very beginning of arrow (e.g., wrote on the main lang impls), and haven't looked back :)
if you're figuring out serialization from scratch nowadays, for most apps, I'd def start by evaluating arrow. A lot of the benefits of protobuf, and then some
Yep; fast+safe+well-tooled common IO format for tabular data, especially columnar, for going across runtimes/languages/processes/servers with zero copy. It supports a variety of common types, including nested (ex: lists, records, ...), modes like streaming, and schemas that can be inferred+checked, so it covers a lot of classic protobuf messaging use cases.
When messages look more like data, even better, as columnar representations are often better for compression & compute. So it's pretty common now for data frameworks, and increasingly, DB connectors. Ex: Our client https://github.com/graphistry/pygraphistry takes a bunch of formats, but we convert to Arrow before sending to our server, we zero-copy it between server-side GPU processes, and stream it to WebGL buffers in the client, all without touching it (beyond our own data cleaning).
The main reason I'd stick to protobuf is legacy, especially awkward data schemas / highly sparse data, and I'm guessing, Google probably has internal protobuf tooling that's faster+easier+better tooled than the OSS stuff.
I'm probably way out of date, but arrow-flight seems primarily innovative for scaling reads across multiple machines, such as in dask envs
For server->client, arrow's record batch representation is useful for streaming binary blobs without having to touch them, but for the surrounding protocol, we care way more about http/browser APIs and how the protocol works, vs the envs + problems flight was built for. So we built some tuned layers for pushing arrow record batches through GPU -> CPU -> network -> browser. The NodeJS ecosystem is surprisingly good for streaming buffers, so it's a few libs from there, careful protocol use to ensure zero-copy on the browser side, and tricks around compression. Flight, at least at the time, was more in the way than a help for all that, and all arrow sponsor money goes to ursa labs, so we never ended up having the resources to OSS that part, just the core Arrow JS libs. Our commercial side is starting to launch certain cloud layers that may make it more aligned to revisit & OSS those pieces, but for now, still low on the priority list for what our users care about. Our protocol here is about to get upgraded again, but not fundamentally wrt the network/client parts.
Interestingly, for the server case... despite our using dask etc. increasingly on the server, we don't explicitly use arrow-flight, and I don't believe our next moves here will either. I recorded a talk for Nvidia GTC about our early experiments on the push to doing 90+ GB/s per server, and while parquet/arrow is good here, flight still seems more of a distraction: https://pavilion.io/nvidia (with more resources, I think it can be aligned)
OK thanks for the insight. I havenv't been tracking arrow-flight recently, but it does seem more geared to an RPC use case than one way streaming.
I've been playing with pushing arrow batches using (db -> server-side turbodbc -> network -> browser -> webworker using transferable support), leveraging a custom msgpack protocol over websockets, since most databases don't support connectivity from a browser. Not dealing with big data by any means (max a million records or so), and so far it's been fairly performant.
yep that's pretty close (and cool on turbodbc, we normally don't get control of that part!)
for saturating network, afaict, it gets more into tuning around browser support for parallel streams, native compression, etc. we've actually been backing off browser opts b/c of unreliability across users, and thus focus more on what we can do on the server..
The protobuf itself as format isnt that bad, just the default implementations are bad. Slow compile times, code bloat and clunky apis / conventions. Nanopb is much better implementation and allows you to control code generation better too. Protobuf makes sense for large data, but for small data fixed length serialization with compression applied on top probably would be better.
It's obviously possible to do protobuf with zero parsing/marshalling if you stick to fixed length messages and 4/8 byte fields. Not saying that's a good idea, since there are simpler binary encodings out there when you need that type of performance.
Consider a valid protobuf message with such a field. If you can locate the field value bytes, you can write a new value to the same location without breaking the message. It's obviously possible to the same with the varint type too, as long as you don't change the number of bytes - not so practical, but useful for enum field which has a limited set of useful values (usually less than 128).
Pregenerating protobuf messages you want to send and then modifying the bytes in-place before sending is going to give you a nice performance boost over "normal" protobuf serialization. It can be useful if you need to be protobuf compatible, but it's obviously better to use something like SBE - https://github.com/real-logic/simple-binary-encoding
FWIW, the python protobuf library defaults to using the C++ implementation with bindings. So even if this is a blog post about implementing protobuf in C, it can also help implementations in other languages.
But yes, once you want real high performance, protobuf will disappoint you when you benchmark and find it responsible for all the CPU use. What are the options to reduce parsing overhead? flatbuffers? xdr?
Handwritten ASM for perf is almost never worth it in modern times. C compiled with GCC/Clang will almost always be just as fast or faster. You might use some inline ASM to use a specific instruction if the compiler doesn't support generating it yet (like AVX512 or AES), but even for that there's probably an intrinsic available. You can still inspect the output to make sure it's not doing anything stupid.
Plus it's C so it's infinitely more maintainable and way more portable.
The x86 intrinsics are so hard to read because of terrible Wintel Hungarian naming conventions that I think it’s quite clearer to write your SIMD in assembly. It’s usually easy enough to follow asm if there aren’t complicated memory accesses anyway. The major issue is not having good enough debug info.
I honestly don't think I've seen native windows code in over 20 years at this point. Obviously there's a ton of C++ out there, it's just basically as far away from me as possible.
But this seems to be an edge case where you have to rely on functional programming and experimental compiler flags to get the machine code that you want.
Portability is typically not a big issue, because you can have a fallback C++ implementation.
> Support for Protobuf buffer serialization was a multi-year effort between Microsoft and Google engineers. Changes were spread across multiple repositories.
The C++ parser has been completely rewritten in the last few years to push the current code generation design to its limits. The biggest obstacle in the way of optimizing it further is legacy APIs, especially std::string for string fields, which forces tons of small heap allocations and frees and defeats the benefits of arena allocation.
Changing very widely used APIs is not easy, these things take time.
It's exposed in the API. When you access a string field in protobuf, say foo.my_str_field(), the return type is const std::string&. We have to have a real std::string internally to return a reference to it.
And one of the more important things done at the very beginning of each and every HTTP(S) request is packaging the web request up in a protobuf and send it onwards from the loadbalancer.
Problem is once you parse the protobuf, you have to immediately do other computations on it in the same process. No one needs to parse protobufs all day long like an ML model or doing hashes for crypto.
That doesn't seem to preclude hardware assistance. For example they have also explored hardware acceleration for the tcmalloc fast path allocation by adding circuits to general purpose CPUs. Arguably, Intel BMI descends from a request that Google made years ago to speed up protobuf decoding (and other workloads) on x86.
I'm going to guess most of the time is being spent elsewhere in the systems they are looking at and it is rather rare they have a situation where the parser is dominating. Protobuf is already a winner compared to the JSON mess we're in.
One thing I've been thinking about in C++ land is that just how much the idiomatic usage of RAII actually prevents the compiler from doing it's own tail call optimization. Any object instantiated in automatic storage with a non-trivial destructor is basically guaranteeing the compiler _can't_ emit a tailcall. It's rather unfortunate, but perhaps worth it if the traideoff is well understood. Example: https://godbolt.org/z/9WcYnc8YT
You can still use this trick in C++ if you ensure that the return statements are outside the scopes that have the RAII objects. It's awkward but it's better than nothing. https://godbolt.org/z/cnbjaK85T
I am unable to understand this comment. You're saying that you can't generate a tail call by returning from the middle of a function which needs to clean things up. RAII* is merely syntactic sugar to write this control flow and make it mandatory.
Perhaps it's easier to think of tail-call semantics as simply implementing iteration: it's another way of expressing a for(...) loop. And if you used RAII in the body of your for loop you would expect the same thing.
I can understand the comment: even if the cleanup can be done before the call, allowing the call to be done as a tail call, the compiler will not move up the cleanup code for you, and having the cleanup code last is the default state. With local variables defined inside for loops, they are always destroyed before the next iteration.
Absolutely, RAII is an abstraction (and a useful one), but it has a cost in that it prevents a form of useful optimization because cleanup is required at the destruction of the stack frame. You'd expect the same in C if you explicitly had to call a cleanup function on return from a call.
What C++ does with RAII is make this tradeoff not obvious. std::unique_ptr is a great example to show this: colloquially a std::unique_ptr is "just a pointer", but it isn't in this case because it's non-trivial destructor prevents TCO.
These tail-call functions are part of a program’s inner loop. It seems like we shouldn’t expect allocation within an inner loop to be fast? Other than local variables, that is.
In an interpreter, it seems like either you’re allocating outside the interpreter loop (the lifetime is that of the interpreter) or it’s within a particular (slow) instruction, or it’s part of the language being interpreted and the lifetime can’t be handled by RAII. There will be fast instructions that don’t allocate and slower ones that do.
Interpreters are a bit weird in that there are lots of instructions that do almost nothing so the overhead of the loop is significant, combined with having lots of complication inside the loop and little ability to predict what instruction comes next. This is unlike many loops that can be unrolled.
I suppose the compiler could reorder function calls if it can prove there is no change in behavior? If so, then it could hoist dtors above the call and emit a jump. I doubt any compilers do this.
It does make code harder to debug when something goes wrong. Since tail calls create no stack frames, a call sequence f->g->h where g tail calls h will show up as a stack of (f, h) in the debugger. The fix is easy, just make MUSTTAIL expand to nothing in debug builds. But it's something to keep in mind, and it means your debug mode code will have different memory use characteristics.
That is true, but there is always https://rr-project.org for easy reverse debugging if you're having trouble figuring out where you came from.
If the alternative is to drop to assembly, a C-based approach seems quite easy to debug. You can just add printf() statements! Previously when I had been using assembly language or a JIT, I had to resort to techniques like this: https://blog.reverberate.org/2013/06/printf-debugging-in-ass...
Of course RR is too expensive to be deployed in production builds. So if you are getting core dumps from "production" you won't have this information. So while RR helps it doesn't completely mitigate the tradeoff.
You may be interested in Intel PT snapshots in Linux core dumps, that gdb knows how to interpret and will give you a detailed branch trace. Less cool than rr but still very interesting!
Perhaps a "ring logger" approach could be useful. Append the more useful bits of what would normally go into the stack frame but without the allocation overhead. Seems like a few memcpy's and modulo operations wouldn't hurt the code gen too much.
rr is really a hidden treasure. C/C++ wasn't the same for me after discovering it.
It's sort of like the first time you learn about interactive debugging. Everything you did before that suddenly feels like "caveman coding" and you never want to go back.
Programmer's have traditionally relied on the stack as an (expensive yet incomplete) execution logging system, but the east fix for that is to use an actually log structure instead of the abusing the stack.
Seems like not much of a fix if your code depends on it. In Scheme such behavior would break standard compliance (and lots of programs). And since presumably you'd use this attribute precisely when your code depended on it, disabling it may not be feasible.
Fortunately the patterns generated by such code are no more difficult to debug than simple loops in other languages, so the lack of "history" of your computation seems no more concerning with tail calls than it is with loops (or at least that's how I always looked at it). And people don't seem to be avoiding loops in programming merely for the reason of loops not keeping track of their history for debugging purposes.
Wow thanks for the pointer! That seems unfortunate, I wonder if there is a way to evaluate whether the extra jump is actually worth it, and whether this optimization could be allowed.
If I remove the check for `OptForSize` and `PredTBB == MBB`, we can optimize OP's report, but seem to regress basic tests like llvm/test/CodeGen/X86/conditional-tailcall.ll, literally flipping the branches incorrectly IIUC.
Why is that a problem? I'd figure that a short jump is basically free since the target is likely to be in the instruction cache? Is it an issue of readahead/speculation through multiple jumps?
You'd get equivalent performance with "goto", but not depend on implicit compiler optimizations to save you from stack overflow.
I like the idea of tail calls, but I don't like it being an implicit "maybe" optimization of the compiler. Make it part of the standard, make the syntax explicit, and then both hands in.
The tail call design gives more control over register allocation, and gets the compiler to generate better code by putting fast paths and slow paths in separate functions. I tried to explain this in the article and in my link upthread.
"Applying this technique to protobuf parsing has yielded amazing results: we have managed to demonstrate protobuf parsing at over 2GB/s, more than double the previous state of the art."
I was somewhat surprised to see that was state of the art for protobufs. Simdjson boasts faster throughput, without the benefit of the length encoded headers that are in protobufs. I looked for examples of protobufs using SIMD, but could only find examples of speeding up varint encode/decode.
Article author here. I dumped my test protobuf payload (7506 bytes) to JSON and got 19283 bytes.
So parsing this particular payload at 2GB/s would be equivalent to parsing the JSON version at 5.1GB/s.
SIMD doesn't end up helping protobuf parsing too much. Due to the varint-heavy nature of the format, it's hard to do very much SIMD parallelism. Instead our approach focuses on going for instruction-level parallelism, by trying to remove instruction dependencies as much as possible. With this design we get ~3.5 instructions per cycle in microbenchmarks (which represents a best case scenario).
Making a flagrantly wasteful data format and then using its bloated extent as the numerator in your benchmark will not exactly be a fair comparison. If a protobuf has a packed, repeated field that looks like \x0a\x02\x7f\x7f and json has instead { "myFieldNameIsBob": [ 127, 127 ] } the JSON interpreter has to be 20x faster just to stay even.
That's true, would be interesting to see an "encoded entities per second" comparison. Or maybe a comparison with mostly stringy data where the size is probably comparable.
Article author here. I agree that would be a very englightening benchmark. Protobuf can dump to JSON, so it shouldn't be too much work to dump my benchmark data to JSON and benchmark the parsing with simdjson. Maybe I'll see if I can get this done while this article is still on the front page. :)
Ah, wow, that's great. Apples-to-apples since you can dump the same data to JSON. And shows why HN remains a unique place. Wonder out loud, and maybe get an answer within an update to the article you just read :)
I don't know if this is a fair comparison, as 2GB/s of protobuf will parse a lot more information than 2GB/s of JSON will, since protobuf is a much more space-efficient way to encode your data.
See https://news.ycombinator.com/item?id=26934063 , we may get a fairly sound comparison. Though I imagine the comparison varies a lot depending on the data. As another comment mentioned, a message with a lot of large strings would lean heavily towards protobufs. And in that case, the size wouldn't be much different.
I would just measure the size of the resulting data structures. In a language like C/C++ it could be as simple as memory usage before your parsing function and after
Isn't there also a significant difference in what the input is being parsed to? My expectation is for a protobuf library to parse messages to structs, with names resolved and giving constant time field access. Simdjson parses a json object to an iterator, with field access being linear time and requiring string comparisons rather than just indexing to a known memory offset.
I.e. it seems like simdjson trades off performance at access time for making the parsing faster. Whether that tradeoff is good depends on the access pattern.
But the same could be true for protobuf. Decode fields only when you need them, and 'parse' just to find the field boundaries and cardinality. Did stuff like that for internal protobuf-like tool and with precomputed message profiles you can get amazing perf. Just get the last or first bit of most bytes (vgather if not on AMD) and you can do some magic.
You cannot compare them. Decoding JSON is compressing it essentially, and in order to compare you would need to look at the resulting data structures and how long it takes. strings are comparable, but an integer is bigger exp2( log10( digit_count ) ) I think.
What benefit would length encoded headers provide other than to reduce payload size? With JSON you just have to scan for whitespace, whereas with protobuf you actually have to decode the length field.
Right, a protobuf message that consists of a single 100MB string will be "decoded" dramatically faster than 2GB/s, because you only need visit the tag and the length and store the address and length, aliasing the input.
It's really quite impossible to discuss data encoding performance outside of a given schema.
I’ve opened an issue in LLVM bugzilla concerning jump not being folded with address computation on x86 with a proposed fix. Would love if it gets some attention. https://bugs.llvm.org/show_bug.cgi?id=50042
Also been working on a C language extension to enable guaranteed tail calls along with explicit control over registers used for argument passing. Provided that callee-save registers are used for arguments, calling fallback functions incurs no overhead.
Barebone C looks really interesting! I wonder if the same gains could be achieved in a more architecture-independent way by simply introducing a new calling convention where parameters are passed in the registers that are normally callee-save.
This would let the fast path functions use all registers without needing to preserve any of them. It would also let them call fallback functions that use a normal calling convention without needing to spill the parameters to the stack.
Thank you for the feedback! A new calling convention could probably nail it for many use cases. Sometimes you want something very special though. E.g. LuaJIT pre-decodes instruction prior to dispatch to squeeze some work into branch misprediction delay. There are limited callee save registers available hence it is better to use volatile registers for instruction arguments. It should be possible to reuse the implementation on different architectures and only tweak the register assignment.
Very cool! OT but is there a list of protobuf benchmarks somewhere across languages/implementations? How does it compare to JSON or just dumping raw bytes?
even if you set aside the claimed gains over handwritten imperative loops, being able to tell the compiler to fail unless tail call conversion succeeds will be huge in terms of preventing performance or stack depth bugs from surfacing when someone accidentally makes a change that makes a tail call no longer convertible.
if you ask me, it should be part of the language. the whole "just make sure you shouldn't need a stack and the compiler will probably take care of it" approach has bothered me for years.
Interesting but it seems like the essential function of the tail call in this example is to create a strong hint to the compiler which values should stay in registers. Isn’t there a better way to do that than relying on a seemingly unrelated optimization?
Looking at the LLVM docs for attributes I get the impression that tail call optimization (TCO) only happens when the caller and callee have basically the same kind of arguments. You can see how that's real simple to implement: emit a `jmp` and done. For non-compatible tail calls the compiler would have to emit instructions to fix up the current call frame, and I guess the code for that doesn't exist in LLVM.
I wonder if that's typical of TCO implementations.
I’ve never thought of tail calls in depth before, so quick question about them - the point here I’m getting is to minimise the pushing/popping of registers to the stack from `call` By using a `jmp` instead. That’s all good... but what stack frame does the jumped procedure use? I’m assuming a new stack frame is still created but just without caller’s pushed registers?
There's always some stack frame sitting there; typically the one that called the main loop routine in the first place. At some point a RET instruction will be executed, and control will return to that stack frame's return point. The idea of tail calls is to avoid creating a new stack frame when it doesn't add any value, but stack frames still exist--they have to exist when the last thing that happens in a routine is ordinary instruction processing rather than a CALL.
This article suggests a big reason to use this approach is to seperate hot and cold code.
I assume that's for good use of the CPU's instruction and microcode caches.
Yet in a protobuf parser, I'm surprised there is enough code to fill said caches, even if you put the hot and cold code together. Protobuf just isn't that complicated!
> I assume that's for good use of the CPU's instruction and microcode caches.
I don't think that is the reason. These are microbenchmark results, where realistically all the code will be hot in caches anyway.
The problem is that a compiler optimizes an entire function as a whole. If you have slow paths in the same function as fast paths, it can cause the fast paths to get worse code, even if the slow paths are never executed!
You might hope that using __builtin_expect(), aka LIKELY()/UNLIKELY() macros on the if statements would help. They do help somewhat, but not as much as just putting the slow paths in separate functions entirely.
In particular, the author is talking about CPU registers being spilled to memory, and the need for setting up or tearing down stack frames. Those things can only be eliminated by the compiler for extremely simple functions. The error-handling often isn't.
If you really care about performance there’s no particular reason the whole stack has to be set up at function beginning/end. Compilers are not flexible enough about this, or other things like how they won’t store values in the frame pointer register on i386.
I believe the optimization to do this is called “shrink-wrapping”.
This is a really great result, but i'm curious why this isn't a very common and standard compiler optimization, at least as an option you can enable? It seems like the conditions where it can be applied are pretty easy to identify for a compiler.
Tail calls are a very common optimization, both Clang and GCC have been performing this optimization successfully for a while. What is new is getting a guarantee that applies to all build modes, including non-optimized builds.
If you're interested in this optimization for performance reasons, why would you want an otherwise non-optimized build? It seems that the only important case is the optimized build... where for some reason you're not getting this optimization without explicitly asking for it.
So the question remains... why is the compiler optimization missing this chance to optimize this tail call without it being explicitly marked for optimization?
Are you saying that the achievement outlined in the article is making sure that this optimization is turned on in debug mode?
Because I thought the entire point of the article is that they have made a marked speed up in production mode, not in debug mode. And I've yet to see (what must be obvious to everyone else) why the compiler is missing this obvious optimization in production mode without the explicit markup.
And if the compiler is not missing this optimization in production mode, why is the article saying they've sped up their code by explicitly marking it for optimization?
The C programming language does not provide any guarantees that tail calls will be optimized out in this way. Compilers are free to do it if they want to and it doesn't violate the "as-if" rule, but they are neither required to do it, nor required not to do it.
However, if you can statically GUARANTEE that this "optimization" happens (which is what this new clang feature does), it opens up a new kind of programming pattern that was simply not possible in C before, it was only really possible in assembly. The reason you couldn't do it in C before is that if the compiler decides (which it is free to do) not to optimize the tail call, it adds to the stack, and you will get stack overflow pretty much instantly.
This MUSTTAIL thing is basically an extension to the C programming language itself: if you can guarantee that the tail call happens, you can structure your code differently because there's no risk of blowing the stack in this case. Another language that actually does this is Scheme, in which the language guarantees that tail calls are eliminated, for the very same reason. If a scheme interpreter doesn't do this, it's not a valid Scheme interpreter.
"Debug mode" vs. "Release mode" doesn't really enter into it: if this optimization doesn't happen, the program is no longer correct, regardless of what optimization level you've selected. Asking "why is the compiler missing this obvious optimization in production mode" is missing the point: you have to guarantee that it always happens in all compilation modes, otherwise the code doesn't work at all.
The code has to be structured entirely differently for this optimisation to be possible.
If the code was restructured without marking the optimisation as mandatory the code would break in debug mode (as it would quickly blow the stack)
What's the argument for building in debug mode vs specifying -g to the compiler to build with debug symbols?
I've previously encountered bugs that stubbornly refused to reproduce in a non-optimized build.
One thing that comes to mind is `#ifdef DEBUG`-style macros, although I'm curious if there's anything else I'm missing. Omitted stack frames, e.g. from inlining, perhaps?
One reason that this is not done by default is that it can make debugging a surprise: since each function does not leave a stack frame, stack traces are much less useful. This is not so bad in the case of a tail-recursive function which calls itself, but if proper tail calls are done between multiple functions, you could have A call B tail call C tail call D, and if D crashes the stack trace is just (D called from A).
I’m sure there are some good ways around this problem, and I would love to have proper tail calls available in most languages.
In OP's case, the individual functions are replacing small fragments of code that would have been basic blocks inside a larger function. The tail calls are replacing gotos. Those things also wouldn't have produced a stack trace.
There are other reasons why this style of programming isn't the default. It requires restructuring the program using tail calls. You commandeer the registers that are normally used for function parameters and force the compiler to use them for your most important variables. But at the same time, it also means that trying to call a normal function will compete with those registers. This optimization technique works better if the inner loop that you're optimizing doesn't have many function calls in the fast path (before you break it down in a network of tail-call functions).
I must be really missing something obvious, since I don't know why so many replies are talking about debugging.
We're talking about the speed of production code (aren't we?) that already elides a lot of debugging features. The article doesn't say that they've found a feature for faster debugging, they're saying that explicitly marking tail calls makes their production code faster... so I'm still lost why the compiler can't find these optimizations in production builds without explicit markup.
People are talking about debugging because debugging needs to be possible.
If you blow the stack in a debug build, your application fucking crashes. That makes debug builds useless and can make debugging some problems very difficult. Therefore we need a mechanism that guarantees the code doesn't blow the stack in debug builds either. "Only optimized production builds are executable" is not the path you want to go if it's avoidable.
If you don't have markup to enforce TCO in every build, some build will be broken or needs to use a different code path altogether to avoid such breakage.
If you write this style of code and don't get the optimization, then your test code and debug sessions are dog slow. Much much slower than the old giant switch style parser.
Similarly, if you make a mistake that would cause the optimization not to be applied, you'd rather get a compiler error than suddenly have a 10X performance regression.
I find the parallel between parsing and interpretation fascinating, and something i have never though about before. Is a general knowledge, any insight wether or not this parallel runs deeper than just implementation similarities ?
tailrec only handles "tail" recursion, i.e. tail calls to itself. This is far weaker than general tail "call" optimization required by the technique in the article.
Just here to say that the use of those #defines for huge parameter lists makes sad. I realize that's a common pattern, but if your call list is that big, how about a struct pointer?
That would defeat the entire purpose: they need to be six parameters to ensure that they are all in registers.
However I was considering whether they could be a struct with six members passed by value. If the ABI would pass that in six registers we could get rid of the #defines, which I agree would be nicer.
Every single time there is a link about C/C++, I do a quick "Ctrl+F Rust", and every single time there is some rant about "but Rust is safer than C".
Every. Single. Time.
This article is about a new Clang extension:
> An exciting feature just landed in the main branch of the Clang compiler. Using the [[clang::musttail]] or __attribute__((musttail)) statement attributes, you can now get guaranteed tail calls in C, C++, and Objective-C.
(literally the first line of the article)
What does Rust have to do with this? Nothing.
Does the author suggest that you should only use C for high performance? No.
I do, always, just out of curiosity because seeing peoples view on different languages is always insightful.
> This isn't specific to Rust in any ways.
From what I've seen, Rust comments are the most condescending.
> I'm not sure the latter is less childish than the former.
It is childish to look for specific information (in this specific case: how C and Rust are compared by others) in threads that grow to hundreds of messages?
FYI, I've also looked for C++ and Go comments in this thread, and none of them were a condescending comment like "C is bad, you should use Rust, C is evil and should not be sent to production".
> From what I've seen, Rust comments are the most condescending.
You must have missed the “Java's GC is so bad, just use Go”, “Go's error handling is shit, use exceptions!” or “Rust is so complex it is unusable is the real world”, etc.
> Rust has a planned keyword for this exact feature, namely 'become'. So the author would be able to use it in Rust just as well, as soon as support for it lands in an upstream LLVM release.
The author is demonstrating a new Clang feature. Then, again, what is the point of mentioning Rust?
> writing raw C as the article suggests in order to parse a quasi-standard high-level format is cowboy coding.
So what? Cowboy coding lets you appreciate even more languages where you don't need to do it, AND gives you a better understanding of how they might work.
> it's not the kind of code that should be anywhere close to a real production workload.
Again, not a single time in the article the author suggests that.
> Instead, this feature should be implemented as part of some safe parser generator
Which safe parser generator would you recommend for writing a protobuf parser (preferably one that yields at least 25% of the throughput claimed by the OP)?
Full disclosure: I believe there is no such thing, and if what you're asking the OP is to write one, it would likely benefit greatly from generating code that leverages tail recursion. Yeehaw!
Obviously, this is architecture-specific. Other architectures may use a different calling convention that ruins this kind of manual register allocation. I'd imagine that it would be bad for performance in 32-bit systems, where function arguments are passed via the stack.
--------
> I think it’s likely that all of the major language interpreters written in C (Python, Ruby, PHP, Lua, etc.) could get significant performance benefits by adopting this technique.
I know that at least Lua and Python use "computed gotos" in their inner loops, which also helps the compiler generate better code. The architecture-dependent nature of the tail-call trick could be a problem here. Some of these interpreters also need to work well on 32-bit systems.