But digging deeper, Europe has a bigger middle class than the US, and the US has the largest lower class and upper class, the latter which pulls up the overall average.
So is the average citizen is probably better off in Europe than in the US.
Also, Europe is catching up on the US average income too, which is really more relevant than what the past or current average is. It means that recent US policy is not working in favour of the average citizen.
> Europe is catching up on the US average income too ... It means that recent US policy is not working in favour of the average citizen.
Western Europe isn't seeing faster wage growth than the US. Economically the US is pulling away from Germany, Britain, Italy and France. US income and GDP growth rates have been far higher the last 10 and 20 years than most of its peers.
Economically speaking, Germany's GDP hasn't net expanded since 2007, when it was $3.44 trillion (it was $3.46 trillion for 2016). France and Britain are similar. French GDP was $2.66 trillion in 2007, it was $2.46 trillion in 2016.
In that time, 2007 to 2016, the US added GDP larger than the entire German economy (about $4.5 trillion).
It's practically impossible to generate broad wage gains if you don't grow the whole economic pie. That's why French wages have been so stagnant for so long, despite all the supposedly labor friendly approaches there.
The US middle class has contracted because more people have moved up and out of the middle class and into the upper classes, than have moved down and out (that's true over 10, 20, 30 years of time):
The formerly extremely poor 1/2 of Europe in the East has seen dramatic improvement since the end of the USSR. You can see that dramatic improvement in several countries like Czech, Slovakia, Romania (more recently), etc. Many are still doing very poorly at growing their economies, including Bulgaria, Moldova, Hungary, Belarus, Macedonia, Albania, Ukraine, Croatia, Bosnia.
The median incomes of Latvia and Lithuania are still around 1/4 that of the US, Estonia is closer to 1/3 that of the US.
> The US middle class has contracted because more people have moved up and out of the middle class and into the upper classes, than have moved down and out
The study cited directly in the Washington Post opinion piece (and indirectly, by way of a WSJ opinion piece, in the Forbes piece -- good effort there passing off the same underlying study as if it were two independent sources) excludes adult children living with parents from the analysis, which makes it completely broken, since that's a living pattern that is known to be more common among adults with lower income relative to the cost of living, and which has been observed to increase over the time period the study addresses. [0]
So, yeah, if you ignore a growing share of young adults that are unable to afford to live independently, the share of the remaining population that is in higher economic strata by income is greater.
Clever spin, but not really a good representation of the reality.
Would you go ahead and break out the the impact you're claiming as it pertains to adult children living with their parents? I disagree that it makes it completely broken, the effects shown in the study are dramatic, rather than subtle. You'll need to show an equally dramatic impact from adult children living with their parents having a counter effect.
That study also makes adjustments for household size. Further, average household sizes are smaller today than they were in 1980, by about 10%. That trend has been persistent, with household sizes shrinking considerably since the 1950s/1960s.
The upper middle class expanding from 12.9% of households to 29.4% of households, cannot be explained by your premise.
The change in adult children living with their parents between 1994 and 2016, is a mere 4%. From 27.5% to about 31.5%. And most likely that figure is set to decline a bit from here given the very low unemployment rate.
That 4% change, for example, could explain some of the drop in the poor and near poor, from 24.3% of households to 19.8%; and the lower middle class falling from 23.9% to 17.1% of households. However it very obviously fails to explain the change on those two combined. And it entirely fails to explain the epic increase in the upper middle class.
> Would you go ahead and break out the the impact you're claiming as it pertains to adult children living with their parents?
No, barring a grant to do so, I'm not going to dig into the paper’s source data and rerun the analysis without the methodological errors, of which the treatment of the demographic noted is just the most glaring, should be obvious to even a layman at the time who had been basically attentive to the news, much less anyone seriously trying to do honest analysis. Among the other methodological errors (and this is not intended to be an exhaustive list):
(1) The paper commendably recognized that current money income is a different thing than class, which “knits together multiple factors such as income, wealth, education, prestige, and cultural sophistication”, and then proceeded to use money income alone to measure class mobility on the assertion that it “current income is closely related to all the factors associated with social class and because data on current income are readily available.” While prestige and cultural sophistication are clearly hard to get annual statistics for, education and wealth distribution are not; there is no excuse for not including these of the intent to is assess a feature which includes them.
(2) Related to #1, Rose does not justify his thresholds as meaningful class thresholds,
(3) Also related to the use of money income as a proxy for class, Rose justifies using fixed real income thresholds (which mean that changes in the median inflation-adjusted income with even with no distribution change within the non-excluded population will result in upward “class” mobility, which, even to the extent that money income correlates to class, doesn't seem to correlate with how it usually correlated with that concept) with the only justification being that that's how the federal poverty line works (which is true, but it's worth noting that this is both a controversial thing about the federal poverty line, and dubious in relation to class generally even if it is appropriate to the purpose of the FPL; there's probably a good reason to think that what is right for the FPL corresponds in some ratio to the boundary for the lower class, but that with successively higher classes income mapping to the class is not simply a constant multiple of the poverty line.)
(4) No justification is given for the method of calculating “family of three equivalents” (using the square root of the ratio of the actual household size to 3 as an income divisor to get the “family of 3” equivalent income.) Note that if one views the FPL as having a reasonably constant relationship to class boundaries as Rose suggests in his justification of the use of constant real-income thresholds, this method of size adjustment is tolerably close for families under 3 (though off in different directions for size 1 vs. size 2) but artificially pushes families over three upward in “class” because it understates the additional income needed to stay at the same level with more family members.
Are you suggesting you think that kind of housing valuation in relation to the size of the economy, is sustainable? The gap between US housing vs Canadian housing vs economic size, is not subtle, it's extreme. The same kind of housing debt vs economic size representation, is why Sweden's median net wealth level is lower than the US median. Having housing be such an extreme share of the economy, usually has predictable consequences (which the US previously took a hit for).
You'll also need to adjust that 2014 middle class story, for the fact that Canada hit an economic skid shortly thereafter when oil imploded, and the dollar went up a lot (as have most US assets). That occurred almost immediately after that story. The dollar going up a lot by itself is enough to have dramatically altered the wealth balance in question. The Canadian Dollar was around 0.95 to 1 at that time, it's now at 0.78.
> The US middle class has contracted because more people have moved up and out of the middle class and into the upper classes, than have moved down and out (that's true over 10, 20, 30 years of time)
I think this is a super interesting phenomenon, and I honestly don't understand how the migration from middle to upper class works in practice, particularly in the face of technological un(der)employment. (And nobody has been able to explain it to me.)
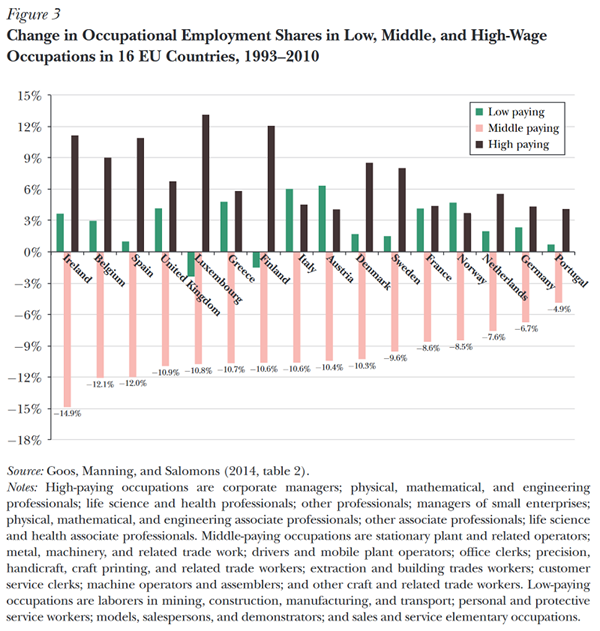
However, the exact same is happening in the EU as well (graph: http://slatestarcodex.com/blog_images/techun_polarization.pn...) so it's not like it's some libertarian US-only miracle (or that labour-friendly rules would prevent it from happening for that matter).
I've responded to the GP about how the US study cited is misleading, but the graph here seems to be worse, as it seems to simply misrepresent the data in the cited source, "Goos, Manning, Salomons (2014; Table 2)". Looking in the paper that it appears to be referencing [0], Table 2 shows -- instead of the across the board decreases in share of jobs in the low wage sector with increases in the middle and high wage sectors shown on the graph -- increases in most countries in both the low (Finland and Luxembourg being exceptions) and high (all countries) sectors, and decreases in the middle wage sector (again, all countries.) The first sentence of the conclusion of the paper states: "The employment structure in Western Europe has been polarizing with rising employment shares for high-paid professionals and managers as well as low-paid personal service workers and falling employment shares of manufacturing and routine office workers."
So is the average citizen is probably better off in Europe than in the US.
Data: https://www.citylab.com/life/2017/04/euro-vs-american-middle...
Also, Europe is catching up on the US average income too, which is really more relevant than what the past or current average is. It means that recent US policy is not working in favour of the average citizen.